[Operational Guide] How to Automate Excel Formatting and Data Consolidation Using Python and openpyxl
How to Automate Excel Formatting and Data Consolidation Using Python and openpyxl
01. The Friday Excel Routine Pain
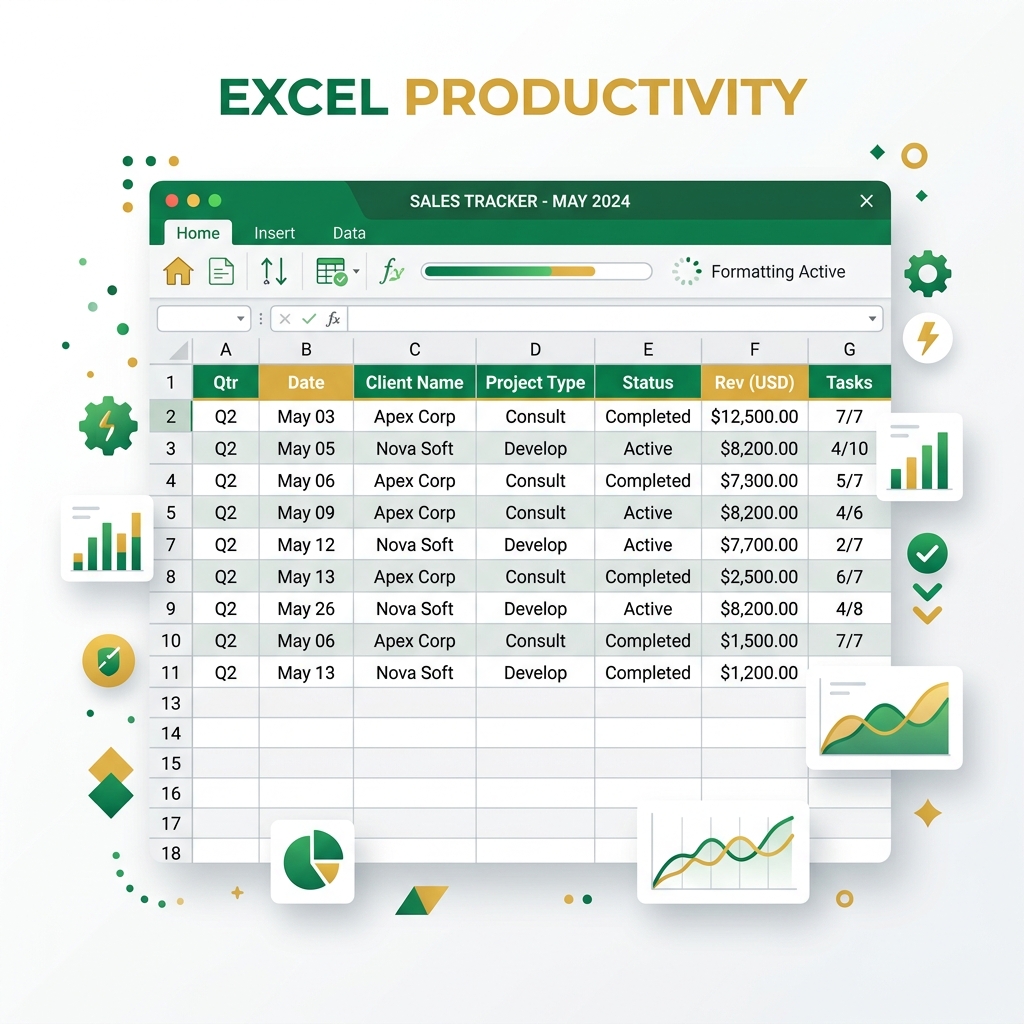
Every Friday morning, our operations manager sat at their desk to perform what we called the Consolidation Ritual. It was a tedious, manual process that wasted half the day.
The task was always identical: open five different CSV files exported from regional sales databases, manually copy and paste their rows into a master Excel spreadsheet, expand the column widths so the text didn't truncate, adjust header backgrounds to corporate brand colors, and insert SUM formulas at the bottom of the numeric columns. It took about three to four hours of repetitive click-and-drag effort, and it was prone to manual entry errors.
Sometimes, the manager forgot to extend the formula range, causing the report to miss the last three rows of data. Other times, regional items were pasted in the wrong columns, corrupting the metrics. It was clear that using human resources for mechanical copy-paste formatting is a waste of talent.
The solution was automating the entire workflow with openpyxl, a highly flexible Python library designed for reading and writing Excel XLSX documents. With a short script, we automated the data load, merged title rows, styled headers with custom fills, auto-fit columns to content length, and inserted dynamic Excel formulas. What once took three hours now executes in exactly one second. This guide details how to build this exact pipeline.
Return to Operational Guide Outline02. The Architecture of a Modern Excel File
An XLSX file is not a flat binary document; it is a zipped archive of XML structures that store data, styles, and formulas separately.
To write efficient automation scripts, you must understand how Excel structures its datasets. An Excel workbook consists of multiple worksheets, and each sheet is represented as a grid of coordinate cells (e.g. A1, B4). Under the hood, the Excel file stores cell values in one XML file, styling definitions (fonts, borders, fills) in a styling registry, and layout settings in metadata tables.
When you use a library like openpyxl, Python does not interact directly with a graphic interface. Instead, it generates and manipulates the underlying XML tags programmatically. This decoupling allows openpyxl to build highly customized sheets, but it also means that styling elements must be defined and applied cell by cell.
For instance, setting the background fill on a merged range requires applying that fill to every cell within the coordinates, not just the top-left cell. Similarly, enabling gridlines or specifying numeric formats is done by writing properties directly onto the worksheet view state. Understanding these rules ensures your generated spreadsheets look professional when opened in Microsoft Excel.
Return to Operational Guide Outline03. The Python Automation Stack
We only need a single external library to build production-grade Excel sheets. The rest is standard Python.
The primary library used to read, manipulate, style, and write native Microsoft Excel XLSX file structures programmatically.
Contains style wrappers like Font, PatternFill, Alignment, Border, and Side to build beautiful spreadsheets in Python.
Provides helper functions like get_column_letter to dynamically calculate column spans during auto-fitting loops.
Python's native parsers to read raw regional transaction records before feeding them to the Excel formatting engine.
Install the Excel engine library using your package manager:
pip install openpyxl04. Step 1 — Initialize Workbook & Grid Settings
Instantiate the workspace and ensure gridlines remain visible to maintain readability.
The first step is importing openpyxl, creating a new workbook, and fetching the active worksheet. By default, some versions of Excel hide gridlines when you apply background fills to cells. To prevent this, we explicitly configure the worksheet view properties to force gridline visibility.
import openpyxl

def init_sheet(output_path: str) -> tuple:
    """Creates a workbook, forces gridlines, and returns the sheet object."""
    wb = openpyxl.Workbook()
    ws = wb.active
    ws.title = "Consolidated Report"

    # Force grid lines to show in Excel viewer
    ws.views.sheetView[0].showGridLines = True

    return wb, ws

wb, ws = init_sheet("test.xlsx")05. Step 2 — Define Font & Color Style Objects
Define your styling elements once as immutable objects to enforce design consistency across your report columns.
A major mistake in Excel automation is applying ad-hoc fonts and colors inline. This practice leads to messy spreadsheets with varying designs. Instead, declare your design system at the beginning of the script. Define font families, title sizes, header fills (e.g. emerald green), total borders, and cell alignments as reusable style instances.
from openpyxl.styles import Font, PatternFill, Alignment, Border, Side

# Font styles
title_font  = Font(name="Calibri", size=16, bold=True, color="FFFFFF")
header_font = Font(name="Calibri", size=11, bold=True, color="FFFFFF")
data_font   = Font(name="Calibri", size=11)

# Solid fill colors
title_fill  = PatternFill(start_color="10B981", end_color="10B981", fill_type="solid")
header_fill = PatternFill(start_color="065F46", end_color="065F46", fill_type="solid")

# Alignments
center_align = Alignment(horizontal="center", vertical="center")
left_align   = Alignment(horizontal="left", vertical="center")
right_align = Alignment(horizontal="right", vertical="center")06. Step 3 — Populate Data and Append Formulas
Iterate through your datasets, apply specific formatting constraints based on column data type, and write dynamic formulas.
def write_data_and_summary(ws, data_records: list):
    start_row = 5
    for idx, row_data in enumerate(data_records):
        row_num = start_row + idx

        # Populate text values
        ws.cell(row=row_num, column=1, value=row_data["date"]).alignment = center_align
        ws.cell(row=row_num, column=2, value=row_data["region"]).alignment = center_align
        ws.cell(row=row_num, column=3, value=row_data["item"]).alignment = left_align

        # Populate numeric values and apply format rules
        qty_cell = ws.cell(row=row_num, column=4, value=row_data["units"])
        qty_cell.alignment = right_align
        qty_cell.number_format = "#,##0"  # Integer formatting

    end_row = start_row + len(data_records) - 1
    total_row = end_row + 2

    # Insert Excel SUM formula programmatically
    total_cell = ws.cell(row=total_row, column=4, value=f"=SUM(D{start_row}:D{end_row})")
    total_cell.number_format = "#,##0"
total_cell.alignment = right_align07. The Complete Script (Copy-Paste Ready)
A fully consolidated script that automates workbook creation, data entry, formatting, cell borders, and auto-fitting.
import openpyxl
from openpyxl.styles import Font, PatternFill, Alignment, Border, Side
from openpyxl.utils import get_column_letter
import os

def build_sales_report(data: list, path: str):
    wb = openpyxl.Workbook()
    ws = wb.active
    ws.title = "Consolidated Report"
    ws.views.sheetView[0].showGridLines = True

    # Styling Assets
    font_title = Font(name="Calibri", size=16, bold=True, color="FFFFFF")
    font_header = Font(name="Calibri", size=11, bold=True, color="FFFFFF")
    font_data = Font(name="Calibri", size=11)
    font_total = Font(name="Calibri", size=11, bold=True)

    fill_title = PatternFill(start_color="10B981", end_color="10B981", fill_type="solid")
    fill_header = PatternFill(start_color="065F46", end_color="065F46", fill_type="solid")
    fill_total = PatternFill(start_color="D1FAE5", end_color="D1FAE5", fill_type="solid")

    align_center = Alignment(horizontal="center", vertical="center")
    align_left = Alignment(horizontal="left", vertical="center")
    align_right = Alignment(horizontal="right", vertical="center")

    thin_border = Side(style='thin', color='CCCCCC')
    double_border = Side(style='double', color='000000')
    border_cell = Border(left=thin_border, right=thin_border, top=thin_border, bottom=thin_border)
    border_total = Border(top=thin_border, bottom=double_border)

    # 1. Merge and style Title
    ws.merge_cells("A1:F2")
    ws["A1"] = "Weekly Regional Sales Consolidation"
    ws["A1"].font = font_title
    ws["A1"].alignment = align_center
    for r in range(1, 3):
        for c in range(1, 7):
            ws.cell(row=r, column=c).fill = fill_title

    # 2. Add headers
    headers = ["Date", "Region", "Rep", "Item", "Units", "Cost"]
    for col_idx, h in enumerate(headers, start=1):
        cell = ws.cell(row=4, column=col_idx, value=h)
        cell.font = font_header
        cell.fill = fill_header
        cell.alignment = align_center
        cell.border = border_cell

    # 3. Populate data
    start_row = 5
    for idx, r in enumerate(data):
        row = start_row + idx
        ws.cell(row=row, column=1, value=r["date"]).alignment = align_center
        ws.cell(row=row, column=2, value=r["region"]).alignment = align_center
        ws.cell(row=row, column=3, value=r["rep"]).alignment = align_left
        ws.cell(row=row, column=4, value=r["item"]).alignment = align_left

        u_cell = ws.cell(row=row, column=5, value=r["units"])
        u_cell.alignment = align_right
        u_cell.number_format = "#,##0"

        c_cell = ws.cell(row=row, column=6, value=r["unit_cost"])
        c_cell.alignment = align_right
        c_cell.number_format = "$#,##0.00"

        for col in range(1, 7):
            ws.cell(row=row, column=col).font = font_data
            ws.cell(row=row, column=col).border = border_cell

    # 4. Insert dynamic formula row
    end_row = start_row + len(data) - 1
    total_row = end_row + 2

    ws.cell(row=total_row, column=4, value="Total Units").font = font_total
    ws.cell(row=total_row, column=4).alignment = align_right
    ws.cell(row=total_row, column=4).fill = fill_total
    ws.cell(row=total_row, column=4).border = border_total

    total_units = ws.cell(row=total_row, column=5, value=f"=SUM(E{start_row}:E{end_row})")
    total_units.font = font_total
    total_units.alignment = align_right
    total_units.number_format = "#,##0"
    total_units.fill = fill_total
    total_units.border = border_total

    for c in [1, 2, 3, 6]:
        ws.cell(row=total_row, column=c).border = border_total

    # 5. Auto-fit column widths
    for col in ws.columns:
        max_len = 0
        col_letter = get_column_letter(col[0].column)
        for cell in col:
            if cell.row in [1, 2]: continue
            if cell.value: max_len = max(max_len, len(str(cell.value)))
        ws.column_dimensions[col_letter].width = max(max_len + 4, 12)

    wb.save(path)
    print(f"[SUCCESS] Report saved to: {path}")

# Local Execution Example
if __name__ == "__main__":
    sales_data = [
        {"date": "2026-07-10", "region": "North", "rep": "Alice", "item": "SaaS License A", "units": 15, "unit_cost": 120.0},
        {"date": "2026-07-11", "region": "South", "rep": "Bob", "item": "API Access Addon", "units": 35, "unit_cost": 45.0},
        {"date": "2026-07-12", "region": "West", "rep": "David", "item": "Data Pipeline Pro", "units": 12, "unit_cost": 250.0},
    ]
build_sales_report(sales_data, "weekly_sales_report.xlsx")08. Adjusting Column Widths Automatically
Never let your data truncate. Use openpyxl column iteration to measure cell text lengths and adjust widths dynamically.
One of the most frustrating aspects of default Excel exports is the ### display warning. This error happens when a column is too narrow to display a formatted numeric value or date. Excel hides the value entirely to prevent users from misreading truncated numbers.
By implementing the auto-fit column loop (as detailed in Section 07), you query every cell in each column and measure the string representation length. You then update the worksheet's column_dimensions mapping with the maximum width detected plus a small padding buffer.
Notice that we skip the merged title cells (rows 1 and 2) in this calculation loop. If you measure merged cells, openpyxl interprets the merged value as belonging entirely to column A, setting column A's width to the length of the entire title. circumventing rows 1 and 2 prevents this formatting distortion.
Return to Operational Guide Outline09. Real-World Business Applications
This exact formatting pipeline is highly adaptable and fits various data reporting requirements.
The pattern of loading raw structured records, applying font registries, and inserting formula cells translates directly to any department that relies on spreadsheet monitoring. Here are the most common deployments:
Format monthly general ledgers with accounting underlines and double-borders. Standardize currency styling rules for compliance.
Consolidate physical stock counts from multiple regional warehouses. Auto-calculate total inventory values using multiplication formulas.
Compile weekly timecards and overtime hours. Format employee names, IDs, and final pay rates in clean data tables.
Track regional sales performance. Color-code top reps using conditional cell styling parameters to highlight accomplishments.
10. What's Next
Once your local Excel formatting is automated, the next logical milestone is securing your operating states.
Automating Excel reports helps teams circumvent manual data entries. However, in secure enterprise environments, storing your operational states on unencrypted local disks or centralized shared storage nodes leaves critical corporate records vulnerable to access interception and corruption attacks.
To achieve trust-minimized operations, you can connect your reporting pipelines directly to hardware-isolated runtimes. By executing your data consolidation engines inside secure enclaves and committing cryptographic checksums directly to on-chain registries, you ensure that only authorized entities can verify and audit company reports.
For a deep-dive on designing hardware-isolated enclaves and verifying attestation documents for multi-tenant swarms, check out the secure runtime design specified in our Master Class series.
Read: Secure Enclave Isolation →

